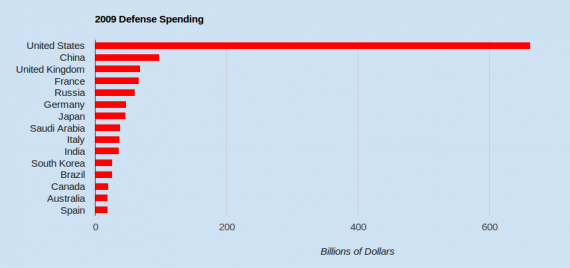
The fifteen countries with the largest annual military budgets. See table below for actual dollar amounts.
Note: This post has been superseded. See 2010 Defense Spending by Country.
Billions and Billions
The fifteen nations with the largest annual military budgets are shown in the chart above (click to enlarge). The United States, with a budget of $636 billion annually, spends more on defense than the next sixteen nations combined. The United States military spending is more than six times that of the next biggest spender, China ($99 billion) and ten times that of Russia ($61 billion). The U.S. accounts for 43% of the world’s yearly defense outlays.
Annual military expenditures by NATO, of which the U.S. is a member, total over one trillion dollars.
Defense Spending by GDP and Per Capita
 When spending is considered by percent of gross domestic product (GDP), the United States at 4.3% falls to eleventh place. Eritrea (20.9%), Georgia (8.5%), and Saudi Arabia (8.2%) take the top spots. Note that Eritrea, Georgia, and some other countries with higher percent GDP spending that the United States do not all appear in the table below.
The highest per capita spending is by United Arab Emirates ($2,653), the United States ($2,142), and Israel ($1,882).
Table Of Annual Defense Spending By Country
Click ONCE on column headers to sort.
| Rank | Country | $billion | %GDP | $ Per Capita |
|---|---|---|---|---|
| 1 | United States | 663.3 | 4.3 | 2,141 |
| 2 | China | 98.8 | 2.0 | 75 |
| 3 | United Kingdom | 69.3 | 2.5 | 940 |
| 4 | France | 67.3 | 2.3 | 977 |
| 5 | Russia | 61.0 | 2.6 | 430 |
| 6 | Germany | 48.0 | 1.3 | 558 |
| 7 | Japan | 46.9 | 0.9 | 401 |
| 8 | Saudi Arabia | 39.3 | 8.2 | 1,524 |
| 9 | Italy | 37.4 | 1.7 | 593 |
| 10 | India | 36.6 | 2.6 | 31 |
| 11 | South Korea | 27.1 | 2.8 | 493 |
| 12 | Brazil | 27.1 | 1.5 | 142 |
| 13 | Canada | 20.6 | 1.3 | 560 |
| 14 | Australia | 20.1 | 1.8 | 893 |
| 15 | Spain | 19.4 | 1.2 | 398 |
| 16 | Turkey | 19.0 | 2.2 | 244 |
| 17 | Israel | 14.3 | 7.0 | 1,882 |
| 18 | Greece | 13.9 | 3.6 | 1,230 |
| 19 | United Arab Emirates | 13.0 | 5.9 | 2,653 |
| 20 | Netherlands | 12.6 | 1.4 | 759 |
| 21 | Poland | 10.9 | 2.0 | 285 |
| 22 | Colombia | 10.1 | 3.7 | 77 |
| 23 | Taiwan | 9.9 | 2.1 | 335 |
| 24 | Iran | 9.2 | 2.7 | 65 |
| 25 | Singapore | 8.0 | 4.1 | 1,003 |
| 26 | Sweden | 6.1 | 1.3 | 657 |
| 27 | Norway | 6.1 | 1.3 | 1,245 |
| 28 | Chile | 5.7 | 3.5 | 212 |
| 29 | Algeria | 5.7 | 3.0 | 77 |
| 30 | Belgium | 5.7 | 1.2 | 525 |
Notes
- Military spending is for 2009 but in 2008 dollars.
- Percent GDP is for 2008, except for Eritrea (not shown in table) which is for 2003.
- Nearly one-quarter of the U.S. budget was associated with operations in Iraq and Afghanistan.
- Not all countries are listed.
Sources
- Stockholm International Peace Research Institute, The SIPRI Military Expenditure Database
- Wikipedia, List of countries by military expenditures per capita
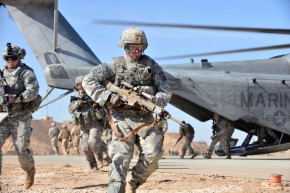
- DoD photograph by Staff Sgt. Daniel St. Pierre, U.S. Air Force

It’s unbelievable the amount of money we spend on the military. We must own the world at this point. I mean how are countries supposed to oppose US Policy when there is this great unspoken threat that looms constantly. It’s the gorilla in the room (or something).
Why not put up the graph with the Percent of GDP? Why not put up a graph with number of forces, or number of countries in whcih forces are actively engaged in operations? We spend A LOT (in some areas too much) on defense spending. We also spend TOO MUCH on healthcare and education (for our return).
As well as, or instead of?
To avoid having a huge table with 154 countries listed, I only show the top 30 by expenditure. Thus, a GDP or Per Capita chart produced from the table would not include all relevant countries. I point this out in the section on GDP and Per Capita. I see your point though, the chart I posted shows the greatest extremes.