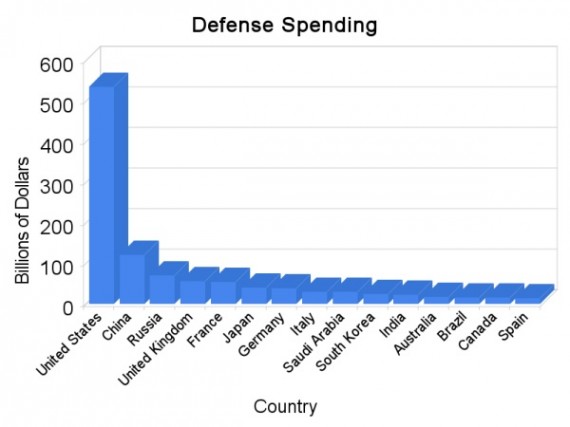
The fifteen countries with the largest annual military budgets. See table below for actual dollar amounts.
This information is outdated. See this post for the latest in military spending.
Defense Spending In The Billions
The chart above shows the fifteen nations with the greatest annual military spending. The United States, with a budget of $535.9 billion annually, spends more on defense than the next fourteen nations combined. One wonders if all that spending by the United States is really necessary, considering that the U.S. military budget is more than four times that of the next largest spender, China, at $121.9 billion. If America’s NATO allies are included just from the chart above (which is not all of NATO), that adds another $207.2 billion in defense spending. Those countries are the United Kingdom, France, Germany, Italy, Canada, and Spain.
Defense Spending By GDP
When spending is considered by percent of gross domestic product (GDP), the United States at 4.1% falls to eighth place. Saudi Arabia (10.0%), Russia (9.9%), and Israel (7.3%) take over first, second, and third place respectively.
Table Of Annual Defense Spending By Country
Click ONCE on column headers to sort.
| Rank | Country | $Billion | %GDP |
|---|---|---|---|
| 1 | United States | 535.9 | 4.1 |
| 2 | China | 121.9 | 4.3 |
| 3 | Russia | 70.0 | 9.9 |
| 4 | United Kingdom | 55.4 | 2.4 |
| 5 | France | 54.0 | 2.6 |
| 6 | Japan | 41.1 | 0.8 |
| 7 | Germany | 37.8 | 1.5 |
| 8 | Italy | 30.6 | 1.8 |
| 9 | Saudi Arabia | 29.5 | 10.0 |
| 10 | South Korea | 24.6 | 2.7 |
| 11 | India | 22.4 | 2.5 |
| 12 | Australia | 17.2 | 2.4 |
| 13 | Brazil | 16.2 | 2.6 |
| 14 | Canada | 15.0 | 1.1 |
| 15 | Spain | 14.4 | 1.2 |
| 16 | Turkey | 11.6 | 5.3 |
| 17 | Israel | 11.0 | 7.3 |
| 18 | Netherlands | 9.9 | 1.6 |
| 19 | United Arab Emirates | 9.5 | 3.1 |
| 20 | Indonesia | 8.4 | 3.0 |
| 21 | Taiwan | 7.7 | 2.2 |
| 22 | Greece | 7.3 | 4.3 |
| 23 | Iran | 7.2 | 2.5 |
| 24 | Myanmar (Burma) | 6.9 | 2.1 |
| 25 | Singapore | 6.3 | 4.9 |
| 26 | Poland | 6.2 | 1.7 |
| 27 | Ukraine | 6.0 | 1.4 |
| 28 | Sweden | 5.8 | 1.5 |
| 29 | Colombia | 5.4 | 3.4 |
| 30 | Norway | 5.0 | 1.9 |
Sources
- The Economist, “…and Wars”. Pocket World in Figures 2009 Edition. Profile Books. Dollar amounts are for 2006, except Indonesia which is for 2005.
- The CIA World Factbook, listing spending on defense programs for the most recent year available as a percent of gross domestic product (GDP); the GDP is calculated on an exchange rate basis, i.e., not in terms of purchasing power parity (PPP).


